

Published:
Lean Improvement
What Is a QC Story? Eight Steps with a Manufacturing Example

Even though improvement activities are compiled into a report, it's often unclear why a particular measure was chosen and what actually changed. The QC Story is a framework for guiding the process from identifying a problem to verifying its cause, implementing countermeasures, and confirming their effectiveness in a single, coherent flow.
This article focuses on "problem-solving" approaches to correcting existing defects, using examples of how to fill out forms for automotive parts unit assembly.
- What is a QC Story? A method for connecting the evidence for improvement.
- Choose the QC story format that best suits your purpose.
- The 8 Steps of a Problem-Solving QC Story
- 1. Choose a theme to work on.
- 2. Understand the current situation using data.
- 3. Determine indicators, targets, and deadlines.
- 4. Determine the activity plan and roles.
- 5. Test the hypothesis about the cause.
- 6. Plan and implement countermeasures that are appropriate to the cause.
- 7. Verify the effects before and after the improvement.
- 8. Standardize and review remaining challenges.
- The relationship between the QC story and the seven QC tools
- Summary: The key to a QC story is the connection between cause, effect, and solution.
- Ollo Factory is a manufacturing-specific AI for work analysis that supports work analysis and standardization after improvement.
- Use the AI to suggest improvements and investigate potential problems.
- Use AI for operational analysis to understand the current situation.
- AI-powered video manuals support standardization after improvements.
- Watch Ollo Factory’s Improvement Suggestions AI in Action
What is a QC Story? A method for connecting the evidence for improvement.
QC stands for Quality Control. A QC story is a method for resolving quality-related issues based on data and facts. It's not a format for filling in report headings, but rather used to understand the gap between the current situation and the target, and to verify the validity of countermeasures.
The Japan Science and Technology Union's explanation of QC stories and QC methods outlines a flow including theme, current situation assessment, goal setting, planning, cause analysis, countermeasures, effectiveness verification, safeguards, and review. The division and terminology of these stages may vary depending on the organization.
This article summarizes the planning and implementation of countermeasures, as well as standardization and review, and organizes them into eight stages. If your company has a presentation format, please use it in accordance with those categories.
Choose the QC story format that best suits your purpose.
type | Contents of the work | Examples of themes |
|---|---|---|
problem solving type | To improve the current situation where goals and standards are not being met. | Reduce the need to re-fasten the unit assembly. |
Task achievement type | We will explore strategies to achieve unprecedented goals and new tasks. | Launching a new product line in a limited space. |
Policy implementation type | Quickly resolve problems whose causes have been identified. | The determined verification equipment is then incorporated into the process. |
Prevention type | Preventing problems that are likely to occur in the future. | Preventing torque setting errors when updating fastening tools |
The choice of type is not the goal of the activity. We need to confirm whether the cause is already known, what we want to achieve, and then spend time on the parts that require investigation and verification. Below, we will discuss problem-solving types that investigate the cause of defects.
The 8 Steps of a Problem-Solving QC Story
1. Choose a theme to work on.
We will assess the impact on quality, frequency of occurrence, and rework burden to determine which issues to prioritize. Since "improving factory quality" is too broad a scope, we will narrow down the target processes, part numbers, and types of defects.
For example, if the goal is "to reduce rework required when fastening the housing of unit A," the process to be investigated and the records to be kept become clear.
2. Understand the current situation using data.
We will check the production volume, defect count, and rework time for the target period. By categorizing by part number, equipment, location of occurrence, and whether or not there was an interruption, we can capture biases that would not be visible from the overall average alone.
It's also necessary to standardize how data is collected. If the inspection method or the definition of a defect changes midway through, do not compare the data as if it were under the same conditions. Don't just look at the numbers; be mindful of the "three realities" principle (actual location, actual site, actual place).
For more information on the Three Realities Principle, please refer to " What is the Three Realities Principle? A method for verifying causes through on-site observation, actual object observation, and actual situation observation ."
3. Determine indicators, targets, and deadlines.
The goal is not just to "reduce defects," but to reach an agreement among stakeholders on what changes will be made and to what extent. The number of defects affected by production volume will be confirmed along with the percentage per unit, etc.
As a hypothetical example, if the current situation is 20 reworks out of 1,000 units, the rework rate is 2.0%. If the provisional target is 10 or fewer reworks per 1,000 units, the target period and production conditions must also be determined. This figure is not a standard value for the manufacturing industry or Ollo's actual performance.
4. Determine the activity plan and roles.
The schedule will follow this order: investigation, cause verification, trial implementation of countermeasures, and effectiveness verification. Time will also be allocated to confirm equipment and quality conditions that cannot be determined solely through manufacturing, with the production technology, quality, and safety personnel.
Plans aren't something you create once and then fixate on. If verifying the cause takes time, we'll revise the activity schedule instead of implementing countermeasures without confirmation.
5. Test the hypothesis about the cause.
We use the conditions that frequently result in defects as clues to examine the actual products, work videos, tool logs, etc. Cause-and-effect diagrams and root cause analyses can be used to organize candidates, but simply completing the diagrams or text does not prove the cause.
For information on the differences between cause-and-effect diagrams and root cause analysis, please refer to " Differences between Root Cause Analysis and Cause-and-Effect Diagrams | How to Use and Conduct Cause Analysis ."
For unit assembly, we investigate methods for resuming work after interruption, part identification, and confirmation of completed fastening. We determine under what conditions differences occur and consider whether the same phenomenon can be explained by other factors.
6. Plan and implement countermeasures that are appropriate to the cause.
We will make specific changes to our work, equipment, and operations based on the identified causes. If the problem is that users don't know where to restart, we will take measures such as improving the display and restart procedures. Simply stating "thorough training" doesn't tell us what has been changed.
For ideas for improvement suggestions, please refer to "10 Improvement Suggestion Ideas for Factory Work | Specific Examples of Unit Assembly and How to Write a Proposal ."
Changing many conditions at once makes it difficult to determine what worked. After confirming quality and safety, test in small increments and record the changes.
7. Verify the effects before and after the improvement.
We will check the production volume, number of defects, and rework time using the same defect definition and aggregation method as before the countermeasures were implemented. If the product mix or the number of support staff are different, we will also include those conditions.
Even if quality improves, we check to make sure that working hours and workload haven't increased too much. If the goal isn't met, we go back to the hypotheses about the cause and the current implementation status before adding more countermeasures.
8. Standardize and review remaining challenges.
Effective measures will be reflected in necessary documentation and operations, such as work procedures, QC process charts, jig inspections, and training. The reasons for the changes and verification methods will be documented to ensure continued implementation even when personnel changes occur.
For information on how to create a QC process chart, please also refer to "[Free Template] How to Create a QC Process Chart | Includes Examples for Manufacturing Companies" .
We will also schedule a review day after the activity is completed. We will organize the points that did not go well and the unresolved conditions, and use them to identify themes for improvement in the next activity.
If you want to streamline the process of analyzing current work processes and creating improved procedure manuals, you can also utilize AI that uses videos.
The relationship between the QC story and the seven QC tools
The QC story outlines the overall flow of the activity, while the seven QC tools are methods for collecting data and examining characteristics. You don't need to use all of the tools.
Collect information on the occurrence: Record the part number, equipment, and details of the defect using a checklist.
Focus on key areas: Use Pareto charts or stratification to determine the scope of work.
Investigate causes and changes: Use cause-and-effect diagrams, scatter plots, control charts, etc., depending on the purpose.
For example, if you create a Pareto chart without data broken down by cause, you won't know the importance of each cause. First, decide which question you want to answer using the tools.
Summary: The key to a QC story is the connection between cause, effect, and solution.
Specify the target and objectives, and collect data that can be measured under the same conditions.
We will investigate the cause, select countermeasures, and then check the quality and workload.
Standardize the measures that proved effective and ensure their continuation after the activity is complete.
By using AI to assist with tasks such as reviewing videos, calculating timestamps, and creating revised procedure manuals, improvement managers can focus more on verifying causes and evaluating countermeasures.
Ollo Factory is a manufacturing-specific AI for work analysis that supports work analysis and standardization after improvement.
Ollo Factory can classify tasks from videos, compile work time statistics, and compare them to exemplary models. It allows you to use footage shot under the same conditions to understand the current state of your QC story and to verify improvements before and after implementation. The AI-generated improvement suggestions are then adopted after verifying the quality and safety conditions at the worksite.
Use the AI to suggest improvements and investigate potential problems.
The AI improvement suggestion tool extracts potential problems from work videos and automatically presents improvement proposals. In the QC story, it helps in selecting a theme to address and creating potential improvement measures.
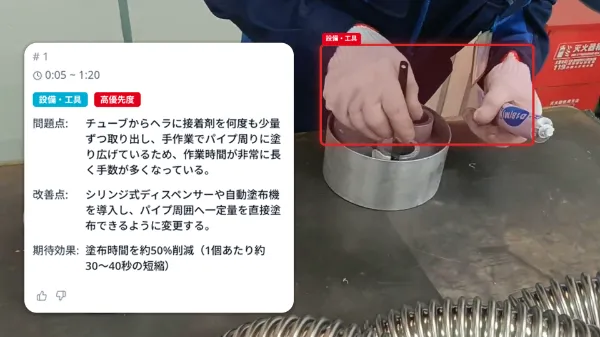 This is a demo screen from the official Ollo website. It does not represent the result of analyzing the process described in the main text.
Use AI for operational analysis to understand the current situation.
The AI-powered work analysis system categorizes work videos into sections and aggregates and visualizes the time spent on each section. You can set classification criteria tailored to your specific work environment, such as work, movement, and waiting time. This helps you understand the current situation and identify the differences between the standard and actual performance.
 This is a demo screen from the official Ollo website. It does not represent the result of analyzing the process described in the main text.
AI-powered video manuals support standardization after improvements.
The AI-powered video manual system automatically divides uploaded work videos into steps and generates task names and descriptions. The improved work processes can then be compiled into manuals, facilitating standardization and training.
 This is a demo screen from the official Ollo website. It does not represent the result of analyzing the process described in the main text.
If you'd like to use video to understand the current situation, investigate the root cause, and standardize improvements, please refer to the Ollo Factory documentation.
Request information from Ollo Factory.
Watch Ollo Factory’s Improvement Suggestions AI in Action
About the author
K.Y. | Business Development Lead & Marketing, Ollo Inc.
K.Y. leads business development and marketing at Ollo Inc., an AI startup originating from the Matsuo Laboratory at the University of Tokyo and the developer of Ollo Factory, a work analysis AI for manufacturing.
After studying engineering and design at university, K.Y. joined a major automaker and worked on new electric-vehicle development, from design through factory production, including hands-on assembly-line training. K.Y. later worked in sales and marketing at a manufacturing startup.
Today, K.Y. helps manufacturing teams use AI to improve the way they work through Ollo Factory.
Back to articles
Related articles
See how Ollo Factory can support your factory
Book a demo
• See the product in action
• Discuss your production needs
• Explore available plans
Book a demo

Request a brochure
• Customer stories
• Key features
• How to get started
