

Published:
Lean Improvement
5 Whys vs. Fishbone Diagram: How to Choose

Both the "why-why analysis" and cause-and-effect diagrams are used to analyze causes, but they organize information differently. The why-why analysis delves into "why" a specific event occurred. A cause-and-effect diagram is used to broadly organize factors that may affect quality or results.
In both cases, simply writing the report does not prove the cause. This article explains how to use each method appropriately and how to connect them to verification, using defects in the assembly of automotive parts as an example.
- The difference between root cause analysis and cause-and-effect diagrams
- Cause-and-effect diagrams are used when you want to organize a wide range of factors.
- Why-why analysis is used when you want to delve deeper into a single phenomenon.
- How to proceed when using both
- 1. Ensure consistency between the definition of the target and the definition of a defect.
- 2. Organize the candidates and narrow down the subjects to investigate.
- 3. Separate facts from hypotheses and confirm causality.
- 4. Verify the countermeasures and their effectiveness.
- Detailed instructions and examples for conducting a root cause analysis.
- Summary: Differentiate between organizing candidates and verifying causality.
- Ollo Factory: A manufacturing-specific AI for work analysis that supports everything from training to improvement.
- Use AI to suggest improvements and identify potential problems.
- AI-powered video manuals support standardization after improvements.
- Watch Ollo Factory’s Improvement Suggestions AI in Action
The difference between root cause analysis and cause-and-effect diagrams
Comparison items | Why and why analysis | Cause and effect diagram |
|---|---|---|
Main purpose | To delve into the cause-and-effect relationships of a specific event. | Structurally organize the factors that influence the outcome. |
Starting point | Specific events, focusing on date, time, target, and content. | The quality characteristics and results you want to investigate |
Organizational Forms | Connect the question and the reason, and branch out if necessary. | Classify the factors based on the bone shape that leads to the characteristic. |
Points to note | Don't turn plausible reasons into facts. | Simply listing candidates does not mean acknowledging them as the cause. |
Next, do | Verify the cause and effect with evidence, and then examine the countermeasures. | Narrow down the factors to investigate and verify them with data and physical objects. |
The cause-and-effect diagram is one of the seven QC tools. It is also introduced as a problem-solving technique in the QC Story explanation by the Union of Japanese Scientists and Engineers . Its purpose is not so much to create a visual diagram, but rather to clarify the subject of investigation and the verification method.
Cause-and-effect diagrams are used when you want to organize a wide range of factors.
Let's say that in unit assembly, "the number of reworks related to fastening has increased." First, we need to standardize what is being counted as a rework, such as unfastened parts, parts not tightened correctly, or parts tilted. If different defects are grouped together, it becomes difficult to pinpoint the cause.
Next, organize the factors that are likely to have an impact, using categories such as people, equipment, materials, and methods. The categories are not fixed; you can choose them according to the characteristics you want to investigate.
cut | Examples of potential items to investigate |
|---|---|
people | Skill level, procedures in case of interruption, and conditions for support work. |
equipment | Tool condition, jig wear, setting changes |
material | Mixed part numbers, part shapes, and supply status. |
method | Procedure for fastening, completion confirmation, and part number switching. |
Simply stating "insufficient training" or "defective tools" is insufficient for verification. We need to specify which training items were not mastered and what changes occurred in the tool's condition. Items not yet checked should be treated as potential contributing factors.
Why-why analysis is used when you want to delve deeper into a single phenomenon.
For example, we might start with an incident where "a single bolt was found to be loose during final inspection in a unit from a specific lot." We then gather video footage from before and after the incident, confirmation from the person involved, tool records, and applicable procedure manuals.
If there's a possibility that the restart location was misidentified after the interruption, we'll investigate whether an actual interruption occurred, where it resumed from, and whether there was a way to confirm the restart location.
question | Examples of hypotheses | Evidence to verify |
|---|---|---|
At what point did the non-conclusion occur? | Possibility that one location was skipped after the interruption. | Video and signing record |
How was the restart location confirmed? | There may not have been a mechanism to save the interrupted position. | Actual work, signs, and procedure manuals |
Why didn't I realize it until it was finished? | Possibility that it could not be detected during completion checks within the process. | Completion conditions and confirmation records |
If there are multiple possible causes, we will separate them into different branches. We will also investigate the reasons why the problem occurred and why it could not be detected during that process, as needed. To fill in the "why" five times, we will avoid connecting unfounded reasons.
How to proceed when using both
1. Ensure consistency between the definition of the target and the definition of a defect.
Decide whether you want to investigate a broad range of defect trends or prevent the recurrence of a specific defect. Ensure you have the correct part number, process, equipment, and timeframe, and confirm how defects are counted and what the denominator is.
If the theme is vague, start by stratifying the problem or assessing the current situation. Sometimes, it's better to separate the problem into a different category before drawing a cause-and-effect diagram.
2. Organize the candidates and narrow down the subjects to investigate.
To reduce the chances of overlooking something, organize the candidates using a cause-and-effect diagram. Then, determine the priority of the investigation based on the conditions under which the problem occurred and the records. Do not assume that only the candidates that received the most support in the meeting are the cause.
If you can trace the context of a specific event, you can start with a root cause analysis. It is not necessary to follow the order of "cause-and-effect diagram → root cause analysis".
3. Separate facts from hypotheses and confirm causality.
For each question, we record what has been confirmed and what remains unconfirmed. Video footage only shows visible movements. Confirming things like the success of fastenings and component dimensions requires tool records, measurements, and physical inspection.
We will also examine any data that does not match our predictions. If non-completion occurs even without interruptions, we must investigate conditions that cannot be explained solely by interruptions.
4. Verify the countermeasures and their effectiveness.
Determine countermeasures for the identified causes, and set responsibilities, deadlines, and evaluation methods. Please differentiate between improved clarity of explanations and a reduction in recurrence.
The comparison should include not only the number of occurrences, but also the number of production volumes and the number of work opportunities.
The differences in conditions before and after the improvement, such as part numbers, equipment, and proficiency, will be preserved.
Check the impact on quality, safety, working hours, and workload.
Effective countermeasures are reflected in procedures, management conditions, and training. If they are not effective, we return to reviewing how the causes were identified and how the countermeasures were implemented.
The AI features that can be used for comparing videos to verify hypotheses about the cause, and for creating procedure manuals after implementing countermeasures, are introduced in the Ollo Factory product documentation.
Detailed instructions and examples for conducting a root cause analysis.
This document summarizes how to perform a root cause analysis, including examples for manufacturing companies and how to verify causes . Use this method to organize potential causes using a cause-and-effect diagram, and then match the question, factors, evidence, and verification results.
Summary: Differentiate between organizing candidates and verifying causality.
Cause-and-effect diagrams broadly organize factors, while root cause analysis delves into specific events.
In both cases, the cause cannot be proven solely by the completed diagrams or text.
We verify the situation using physical objects, records, and video footage, and even confirm the effectiveness of the countermeasures taken.
Analyzing work videos with AI makes it easier to identify the context before and after a problem, as well as instances where the work differs from the example. This streamlines the organization of information for investigation, allowing more time to be spent on confirming cause and effect and considering countermeasures.
Ollo Factory: A manufacturing-specific AI for work analysis that supports everything from training to improvement.
Ollo Factory is an AI-powered work analysis tool specifically designed for the manufacturing industry. It offers features such as extracting potential problems from work videos and automatically creating draft procedure manuals.
By utilizing AI-powered improvement suggestion and AI-powered video manuals , we support everything from investigating root causes using root cause analysis and cause-and-effect diagrams to standardizing improvements after implementation.
Use AI to suggest improvements and identify potential problems.
The AI improvement suggestion tool extracts potential problems from work videos and presents improvement proposals. It helps identify potential problems and improvements before starting cause-and-effect diagrams or root cause analyses.
Furthermore, it can be used to review the work video after the improvements have been made and to check if any other problems have arisen.
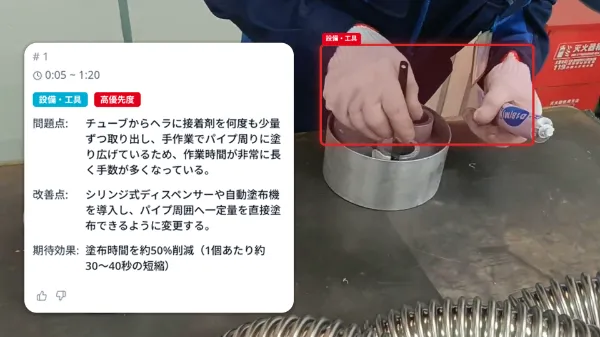 This is a demo screen from the official Ollo website. It does not represent the result of analyzing the process described in the main text.
AI-powered video manuals support standardization after improvements.
The AI-powered video manual system automatically divides uploaded work videos into steps and generates task names and descriptions. The improved work processes can then be compiled into manuals, facilitating standardization and training.
 This is a demo screen from the official Ollo website. It does not represent the result of analyzing the process described in the main text.
If you'd like to proceed from video-based root cause analysis to standardization after improvements, please refer to the Ollo Factory documentation.
Request information from Ollo Factory.
Watch Ollo Factory’s Improvement Suggestions AI in Action
About the author
K.Y. | Business Development Lead & Marketing, Ollo Inc.
K.Y. leads business development and marketing at Ollo Inc., an AI startup originating from the Matsuo Laboratory at the University of Tokyo and the developer of Ollo Factory, a work analysis AI for manufacturing.
After studying engineering and design at university, K.Y. joined a major automaker and worked on new electric-vehicle development, from design through factory production, including hands-on assembly-line training. K.Y. later worked in sales and marketing at a manufacturing startup.
Today, K.Y. helps manufacturing teams use AI to improve the way they work through Ollo Factory.
Back to articles
Related articles
See how Ollo Factory can support your factory
Book a demo
• See the product in action
• Discuss your production needs
• Explore available plans
Book a demo

Request a brochure
• Customer stories
• Key features
• How to get started
